Assunpink Creek at Trenton, NJ
River level and flood forecast · Mercer County
The river is 4.2 ft below flood stage (8.5 ft).
Forecast to fall to 3.3 ft by Thu, Oct 15, 2 PM.
Flow: 379 cubic feet per second (USGS).
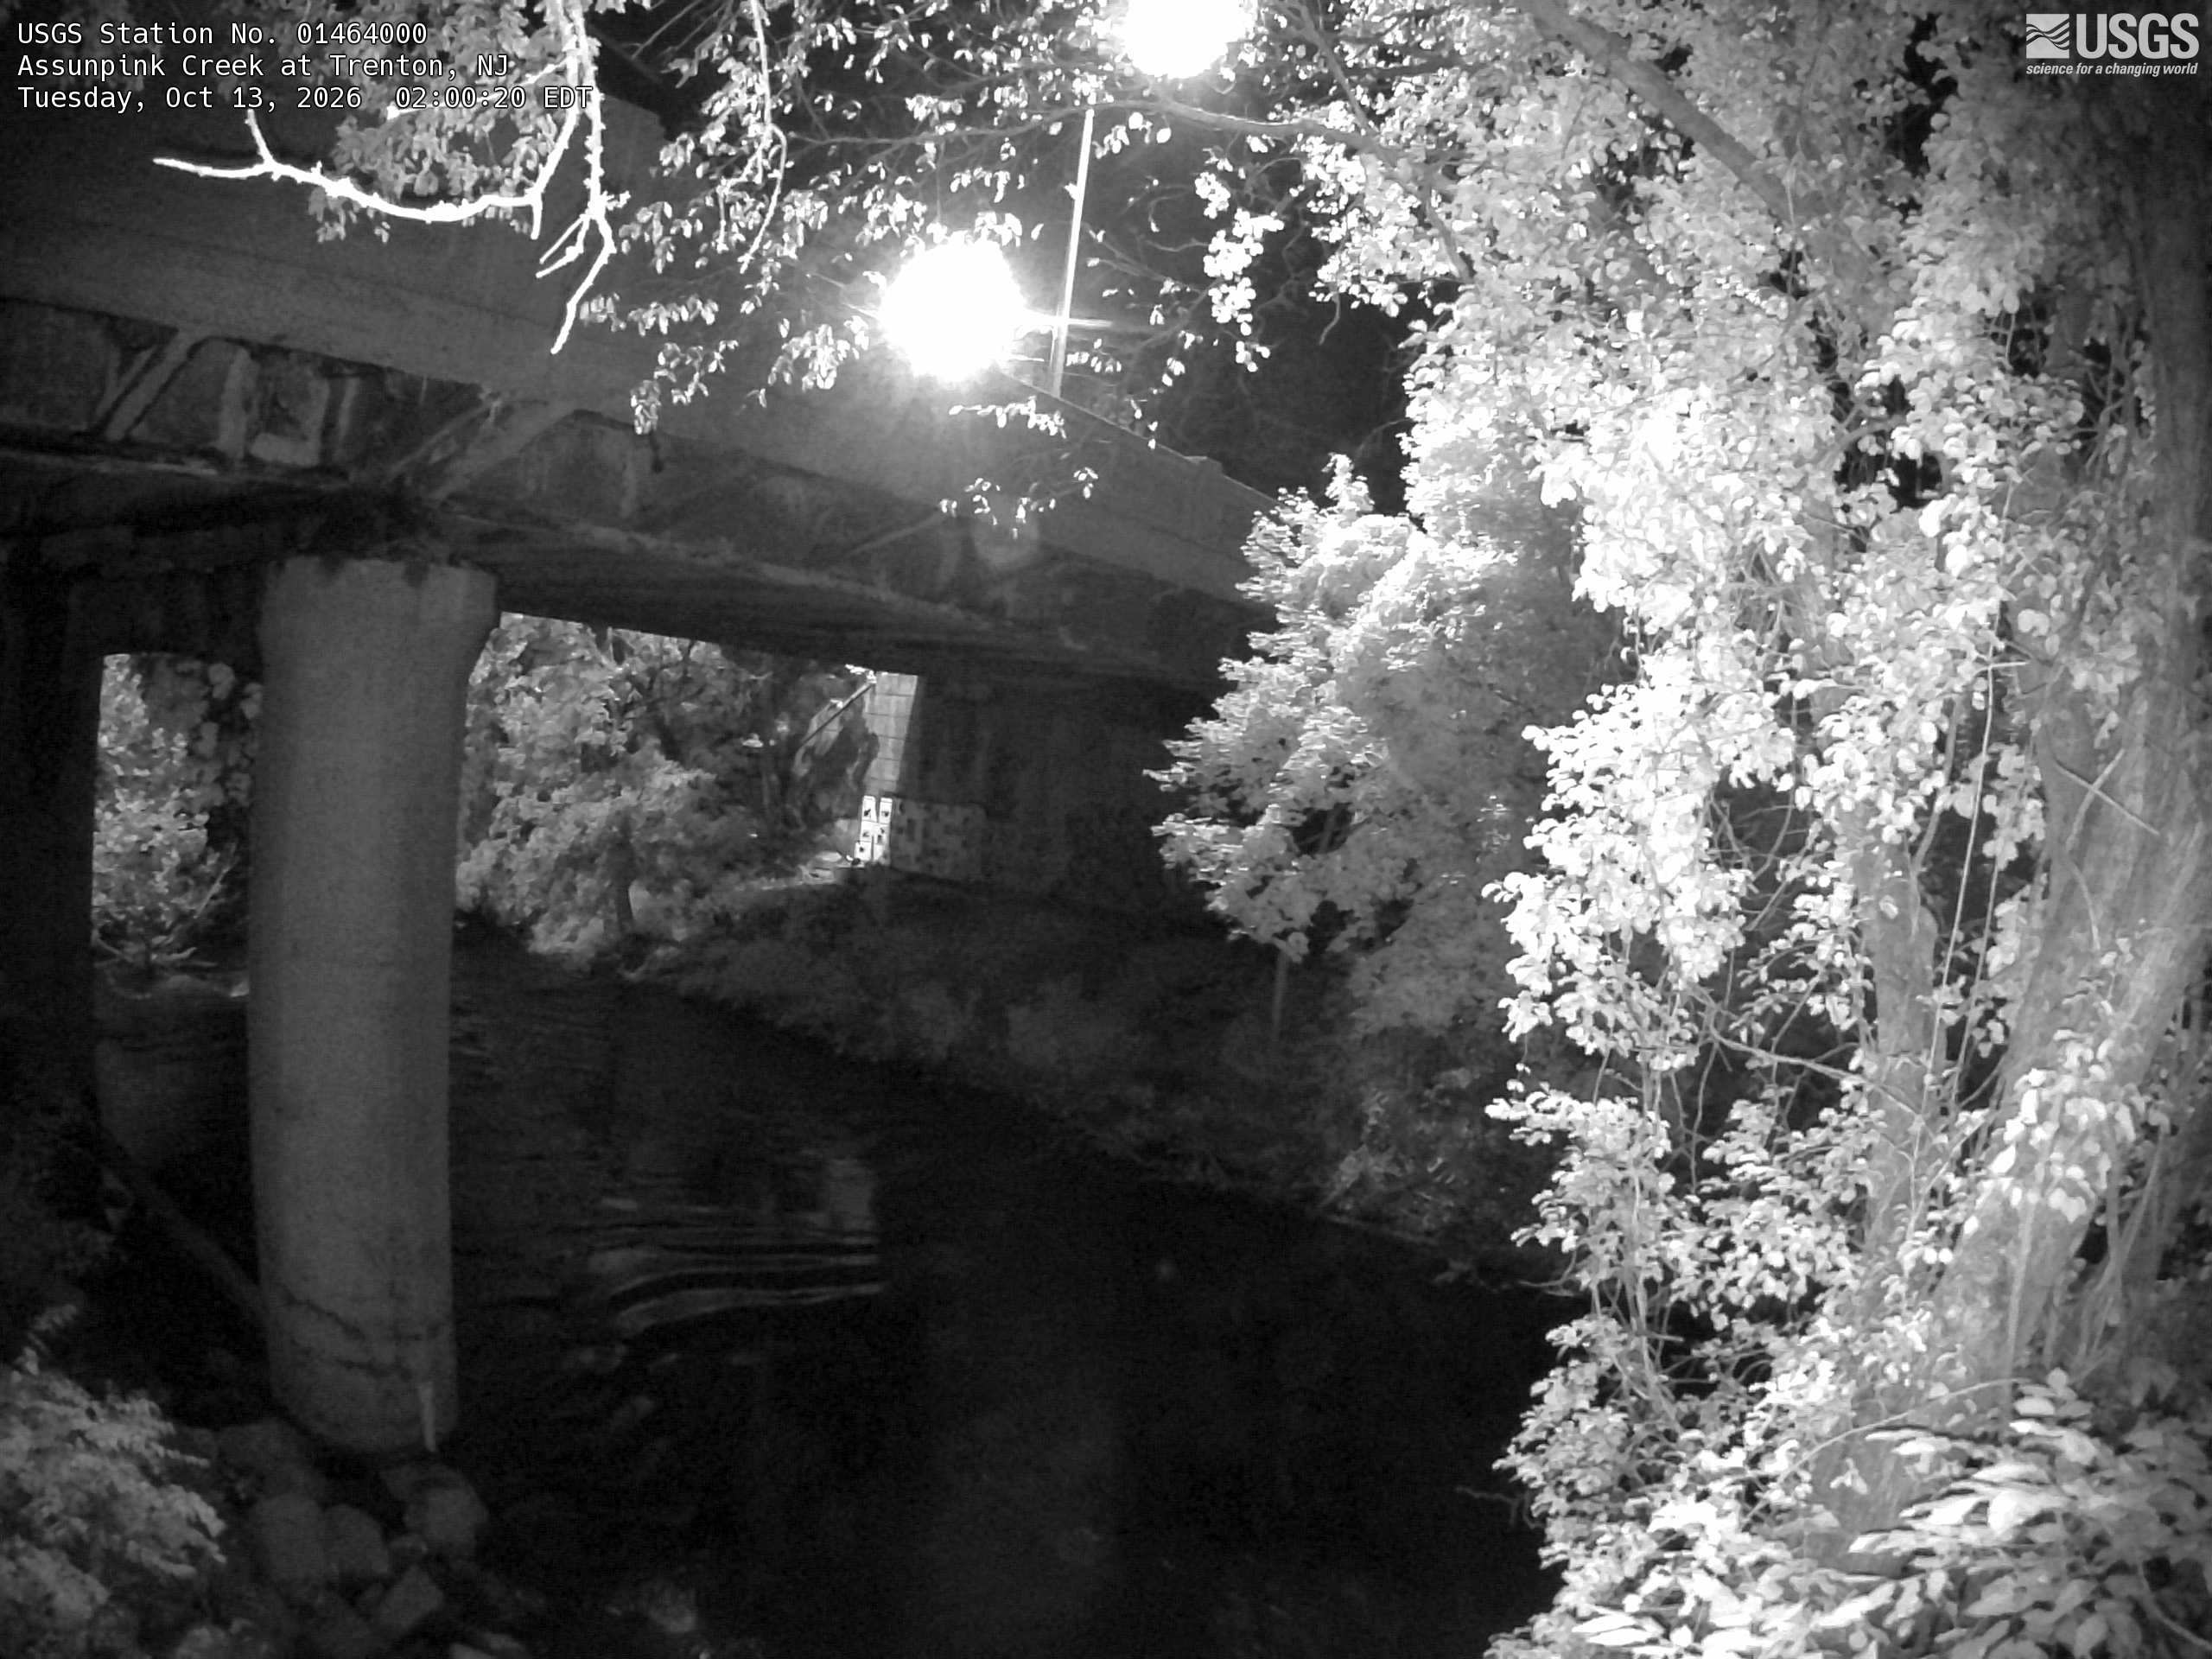
River camera
Watch the time-lapse
Camera by the U.S. Geological Survey. Most take a picture every hour, some every few minutes; many stop at night.
The last 7 days and the forecast
NWS forecast issued Mon, Oct 12, 3:02 PM. Forecasts change as rain falls and as upstream water arrives.
Get flood alerts for this river
An email when the National Weather Service forecasts Assunpink Creek at Trenton to flood, when it floods, and when it's over.
Flood stages
| Major flood stage | 11 ft |
| Moderate flood stage | 9.5 ft |
| Flood stage | 8.5 ft |
| Action stage | 7 ft |
| Record crest (August 28, 2011) | 15.12 ft |
What floods at each level
From the National Weather Service, highest first.
- 15 ftThe Trenton Transit Center is flooded.
- 13 ftNJ Transit and Amtrak rail lines are flooded shutting down service. Amtrak service between Philadelphia and Boston are cancelled. The neighborhood in the vicinity of North Clinton and North Olden Avenues flood. Homes and businesses take on water.
- 11 ftNorth Olden Avenue begins to flood.
- 10 ftMulberry Street flooding increases. Evacuations possible.
- 9 ftMulberry Street begins to flood.
- 6.5 ftAssunpink Park floods. George Page Park floods. Minor street flooding in Trenton.
Highest crests on record
- 15.12 ft — August 28, 2011
- 14.61 ft — July 21, 1975
- 14.01 ft — September 16, 1999
- 13.46 ft — August 28, 1971
- 13.28 ft — April 16, 2007
Recent crests: 8.74 ft (January 10, 2024) · 9.29 ft (December 18, 2023) · 12.59 ft (September 2, 2021) · 8.56 ft (July 18, 2021) · 9.94 ft (November 25, 2018)
Up and down the river, and nearby
Not an official source. River levels, forecasts, flood stages and impacts are from the National Weather Service (TACN4); flow from the U.S. Geological Survey. Readings are provisional. In a flood, follow your local officials and the NWS at weather.gov.