Bad River (WI) at Odanah, WI
River level and flood forecast · Ashland County
The river is 5.6 ft below flood stage (8.5 ft).
Flow: 214 cubic feet per second (USGS).
River camera
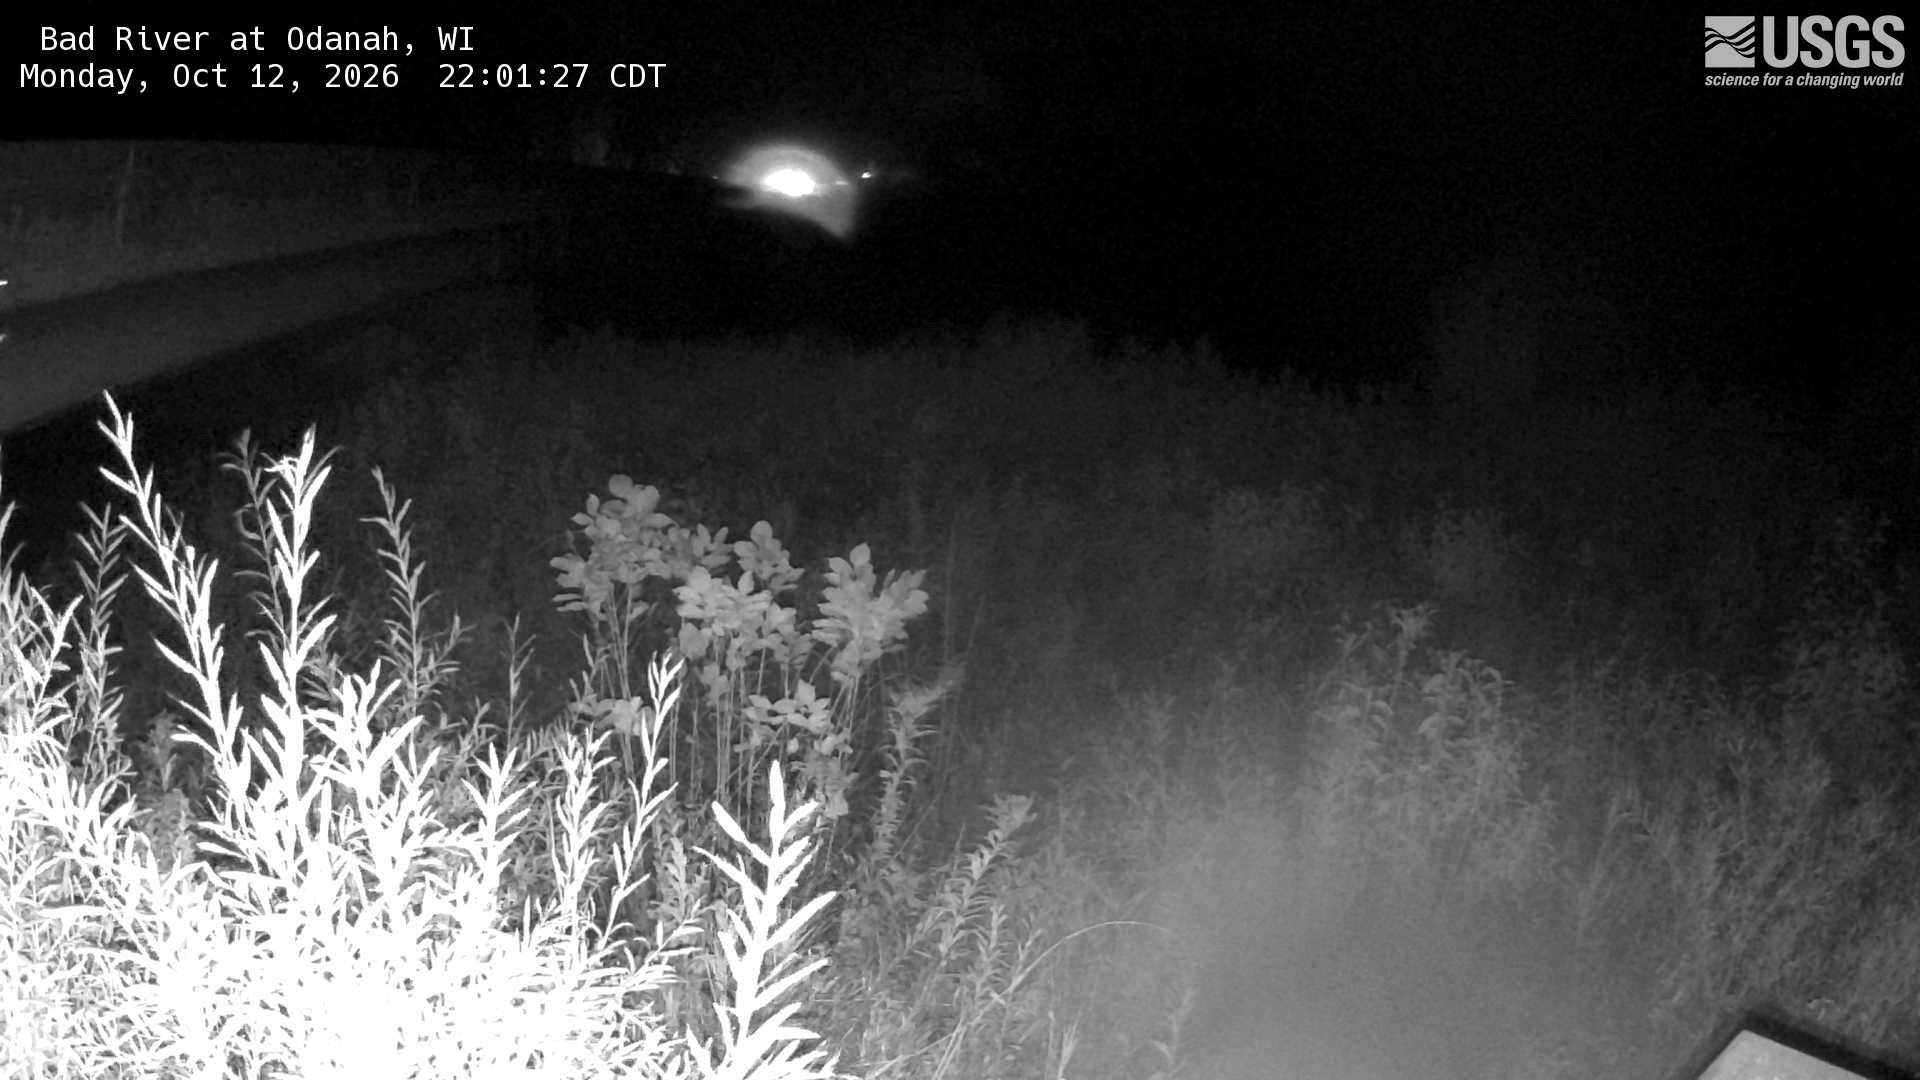
Watch the time-lapse
Camera by the U.S. Geological Survey. Most take a picture every hour, some every few minutes; many stop at night.
The last 7 days and the forecast
NWS forecast issued Sun, Dec 31, 6 PM. Forecasts change as rain falls and as upstream water arrives.
Get flood alerts for this river
An email when the National Weather Service forecasts Bad River (WI) at Odanah to flood, when it floods, and when it's over.
Flood stages
| Major flood stage | 10.5 ft |
| Moderate flood stage | 9.5 ft |
| Flood stage | 8.5 ft |
| Action stage | 7.5 ft |
| Record crest (July 12, 2016) | 11.78 ft |
What floods at each level
From the National Weather Service, highest first.
- 11.78 ftFlood of 2016 high water mark. Major flooding to US Highway 2. Water over the bridge on Government Road.
- 9.3 ftWater begins to flow onto US Highway 2 .35 Miles East of Government Road. Water floods Kakagon Slough causing water to encroach on the Fish hatchery and homes on Kakagon Rd. Water begins flooding the Pow wow grounds.
- 9 ftMany roads and several homes are impacted by flood waters in the Old Odanah area. Government Road south of US Highway 2, Miller Road and State Road will see areas of water flowing over the roadway.
- 8.5 ftMinor flooding begins as water encroaches on State Street through the Sugar Bush.
Highest crests on record
- 11.78 ft — July 12, 2016
- 9.33 ft — June 18, 2018
Recent crests: 9.33 ft (June 18, 2018) · 11.78 ft (July 12, 2016)
Up and down the river, and nearby
Not an official source. River levels, forecasts, flood stages and impacts are from the National Weather Service (BDOW3); flow from the U.S. Geological Survey. Readings are provisional. In a flood, follow your local officials and the NWS at weather.gov.