Root River at Franklin, WI
River level and flood forecast · Milwaukee County
The river is 5.7 ft below flood stage (8 ft).
Flow: 24 cubic feet per second (USGS).
River camera
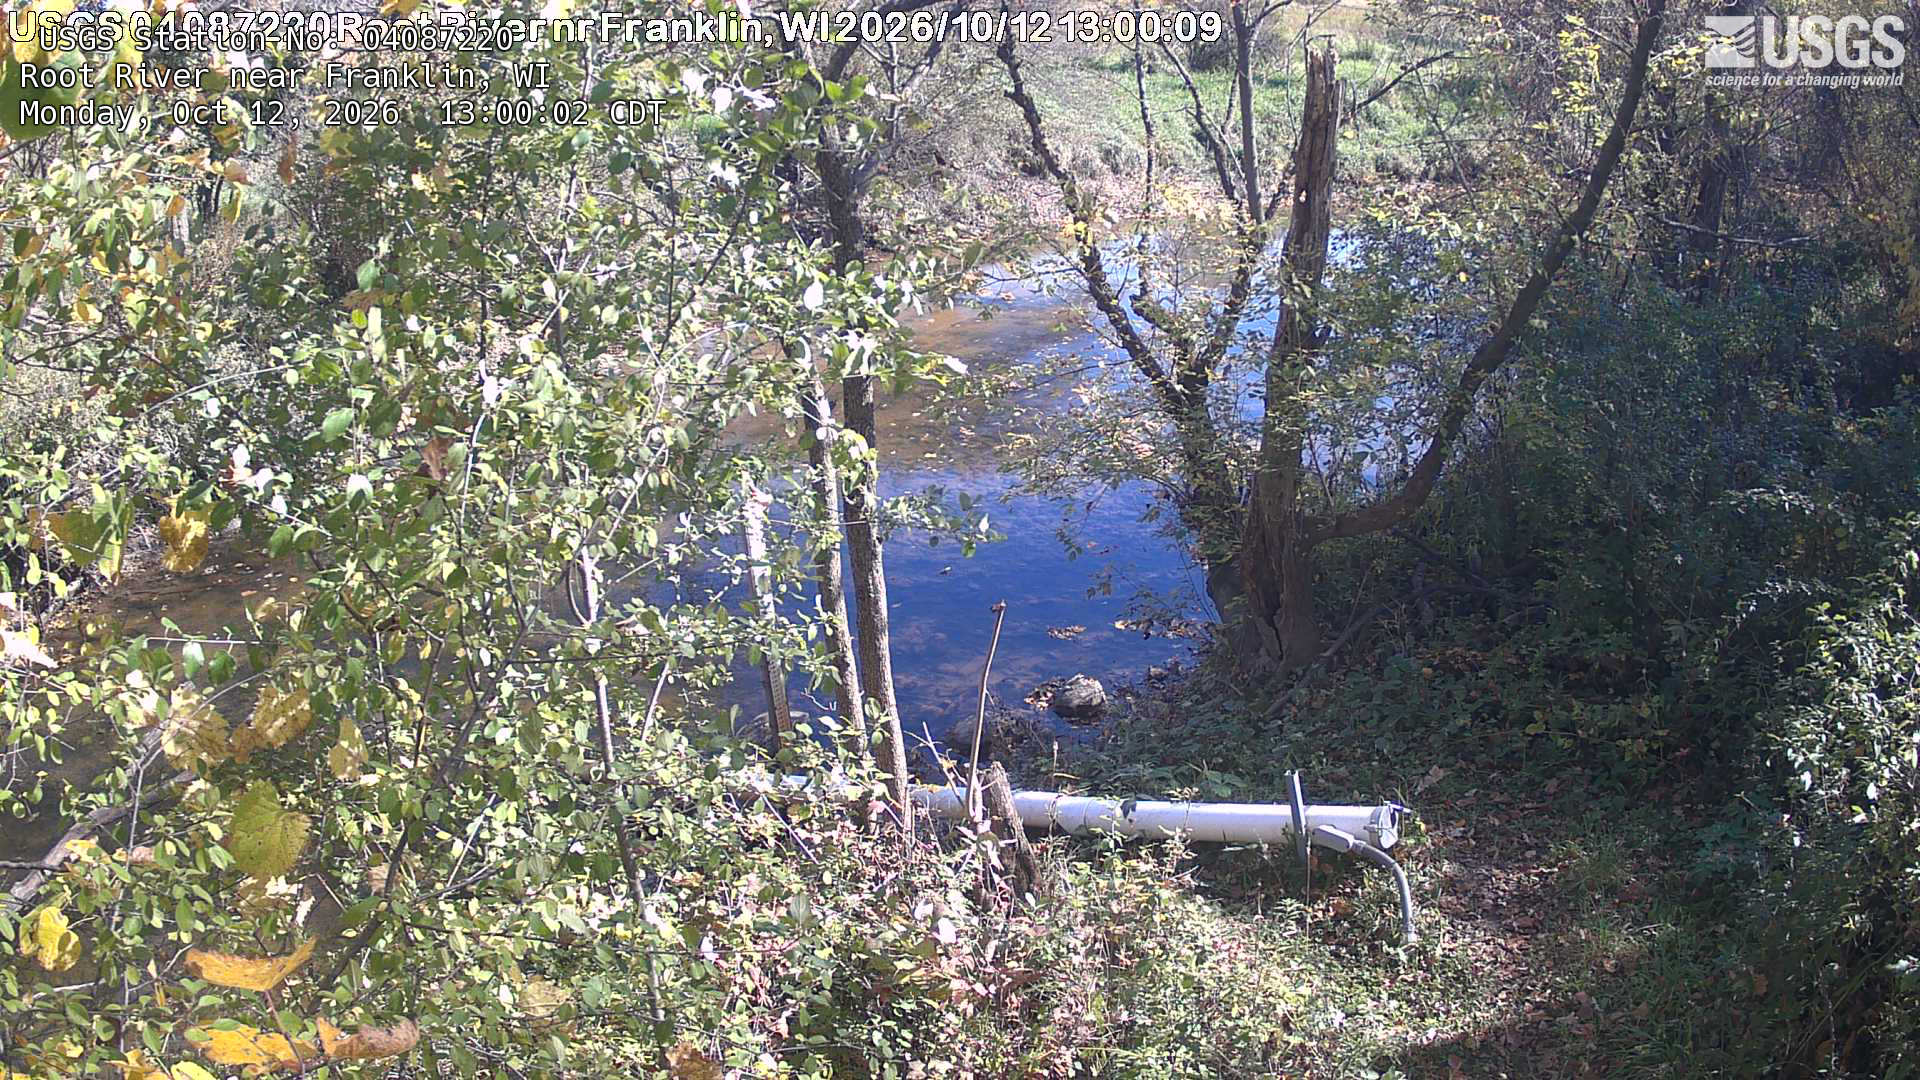
Camera by the U.S. Geological Survey. Most take a picture every hour, some every few minutes; many stop at night.
The last 7 days and the forecast
NWS forecast issued Thu, Oct 1, 9:14 AM. Forecasts change as rain falls and as upstream water arrives.
Get flood alerts for this river
An email when the National Weather Service forecasts Root River at Franklin to flood, when it floods, and when it's over.
Flood stages
| Major flood stage | 12 ft |
| Moderate flood stage | 10 ft |
| Flood stage | 8 ft |
| Action stage | 7 ft |
| Record crest (August 10, 2025) | 11.71 ft |
What floods at each level
From the National Weather Service, highest first.
- 12 ftNicholson Rd, Drexel, S Howell Ave, S 60th and Oakwood Rd, 8 Mile Rd and 27th St, Root River Parkway and Ryan Rd are flooded. Yards along the river are flooded.
- 11 ftNicholson Rd, Drexel, S Howell Ave, S 60th and Oakwood Rd, 8 Mile Rd and 27th St and Root River Parkway are flooded. Water approaches Ryan Rd. Yards along the river are flooded.
- 10.5 ftNicholson Rd, Drexel, S Howell Ave, S 60th and Oakwood Rd, 8 Mile Rd and 27th St flood. Portions of Root River Parkway are flooded. Yards along the river are flooded.
- 9.5 ftOakwood Road near S 60th is flooded. Water approaches 8 Mile Rd and 27th St. Nicholson Rd may be flooded. Some yards along the river are flooded. Portions of Root River Parkway are flooded.
- 9 ftPortions of the Root River Parkway are flooded. Oakwood Road near S 60th is flooded. Some yards along the river are flooded.
- 8 ftA low spot on Oakwood Road is flooded. E County Line Rd floods near Nicholson Rd. Some yards along the river flood.
- 7 ftThere is minor flooding to agricultural land.
Highest crests on record
- 11.71 ft — August 10, 2025
- 11 ft — June 8, 2008
- 10.51 ft — July 23, 2010
- 9.57 ft — March 30, 1960
- 9.48 ft — May 18, 2020
Recent crests: 9.23 ft (April 16, 2026) · 8 ft (April 4, 2026) · 11.71 ft (August 10, 2025) · 8.24 ft (April 3, 2024) · 8.44 ft (February 28, 2023)
Up and down the river, and nearby
Not an official source. River levels, forecasts, flood stages and impacts are from the National Weather Service (FRKW3); flow from the U.S. Geological Survey. Readings are provisional. In a flood, follow your local officials and the NWS at weather.gov.