Wisconsin River at Muscoda, WI
River level and flood forecast · Grant County
The river is 8.0 ft below flood stage (9 ft).
Flow: 4,620 cubic feet per second (USGS).
River camera
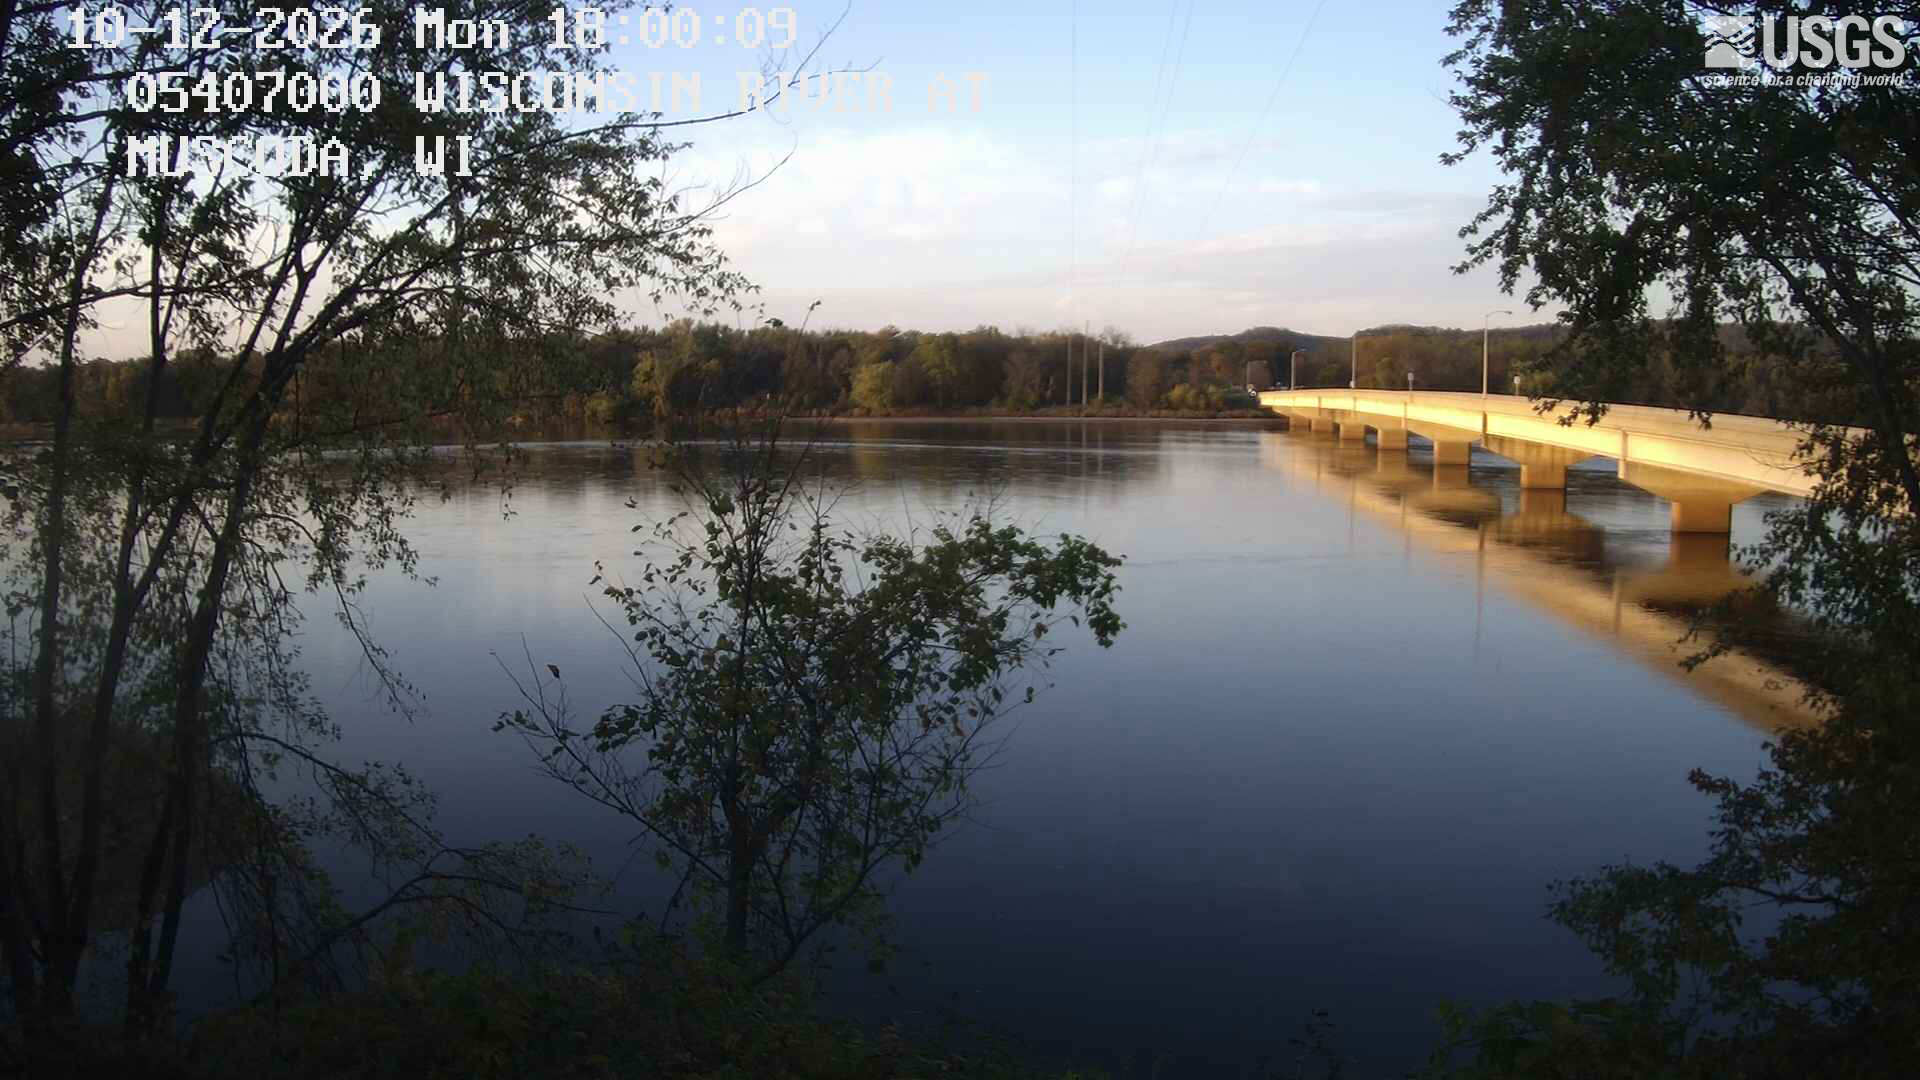
Watch the time-lapse
Camera by the U.S. Geological Survey. Most take a picture every hour, some every few minutes; many stop at night.
The last 7 days and the forecast
NWS forecast issued Sun, Dec 31, 6 PM. Forecasts change as rain falls and as upstream water arrives.
Get flood alerts for this river
An email when the National Weather Service forecasts Wisconsin River at Muscoda to flood, when it floods, and when it's over.
Flood stages
| Major flood stage | 11 ft |
| Moderate flood stage | 10 ft |
| Flood stage | 9 ft |
| Action stage | 7 ft |
| Record crest (September 16, 1938) | 11.48 ft |
What floods at each level
From the National Weather Service, highest first.
- 13.8 ftThe water reaches the low steel on the Highway 80 Bridge over the river.
- 11 ftWidespread lowland flooding is likely, but the town of Muscoda should remain above the flood waters.
- 10 ftThere is extensive lowland flooding. However no flooding has been reported in Muscoda in previous years.
- 9.6 ftHomes on W Lakeshore Drive and E Lakeshore Drive along Avoca Lake (inlet of Wisconsin River) begin sandbagging.
- 9.5 ftFlooding may impact some homes in Boscobel.
- 9 ftThe river begins to go out of its banks in some locations with only minor flooding.
Highest crests on record
- 11.48 ft — September 16, 1938
- 11.1 ft — June 11, 1881
- 10.6 ft — April 16, 1922
- 10.36 ft — March 20, 1973
- 10.34 ft — June 26, 1993
Recent crests: 9.83 ft (April 19, 2026) · 9.48 ft (April 24, 2019) · 9.57 ft (September 30, 2010) · 8.62 ft (June 15, 2008) · 8.2 ft (June 18, 2004)
Up and down the river, and nearby
Not an official source. River levels, forecasts, flood stages and impacts are from the National Weather Service (MUSW3); flow from the U.S. Geological Survey. Readings are provisional. In a flood, follow your local officials and the NWS at weather.gov.